Energy Monitoring is a complex area which involve composite data acquisition in multiple areas. Through our software you will be able to track consumption of Electricity, Heat, Gas, Water and other media. ConnectorIO® Agent as one of very few solutions available on the market is able to handle physical (SI) units of measurement. It does not matter if your measurement device report values using Watts or Kilowatts, we will handle them equally good.
Demand and consumption
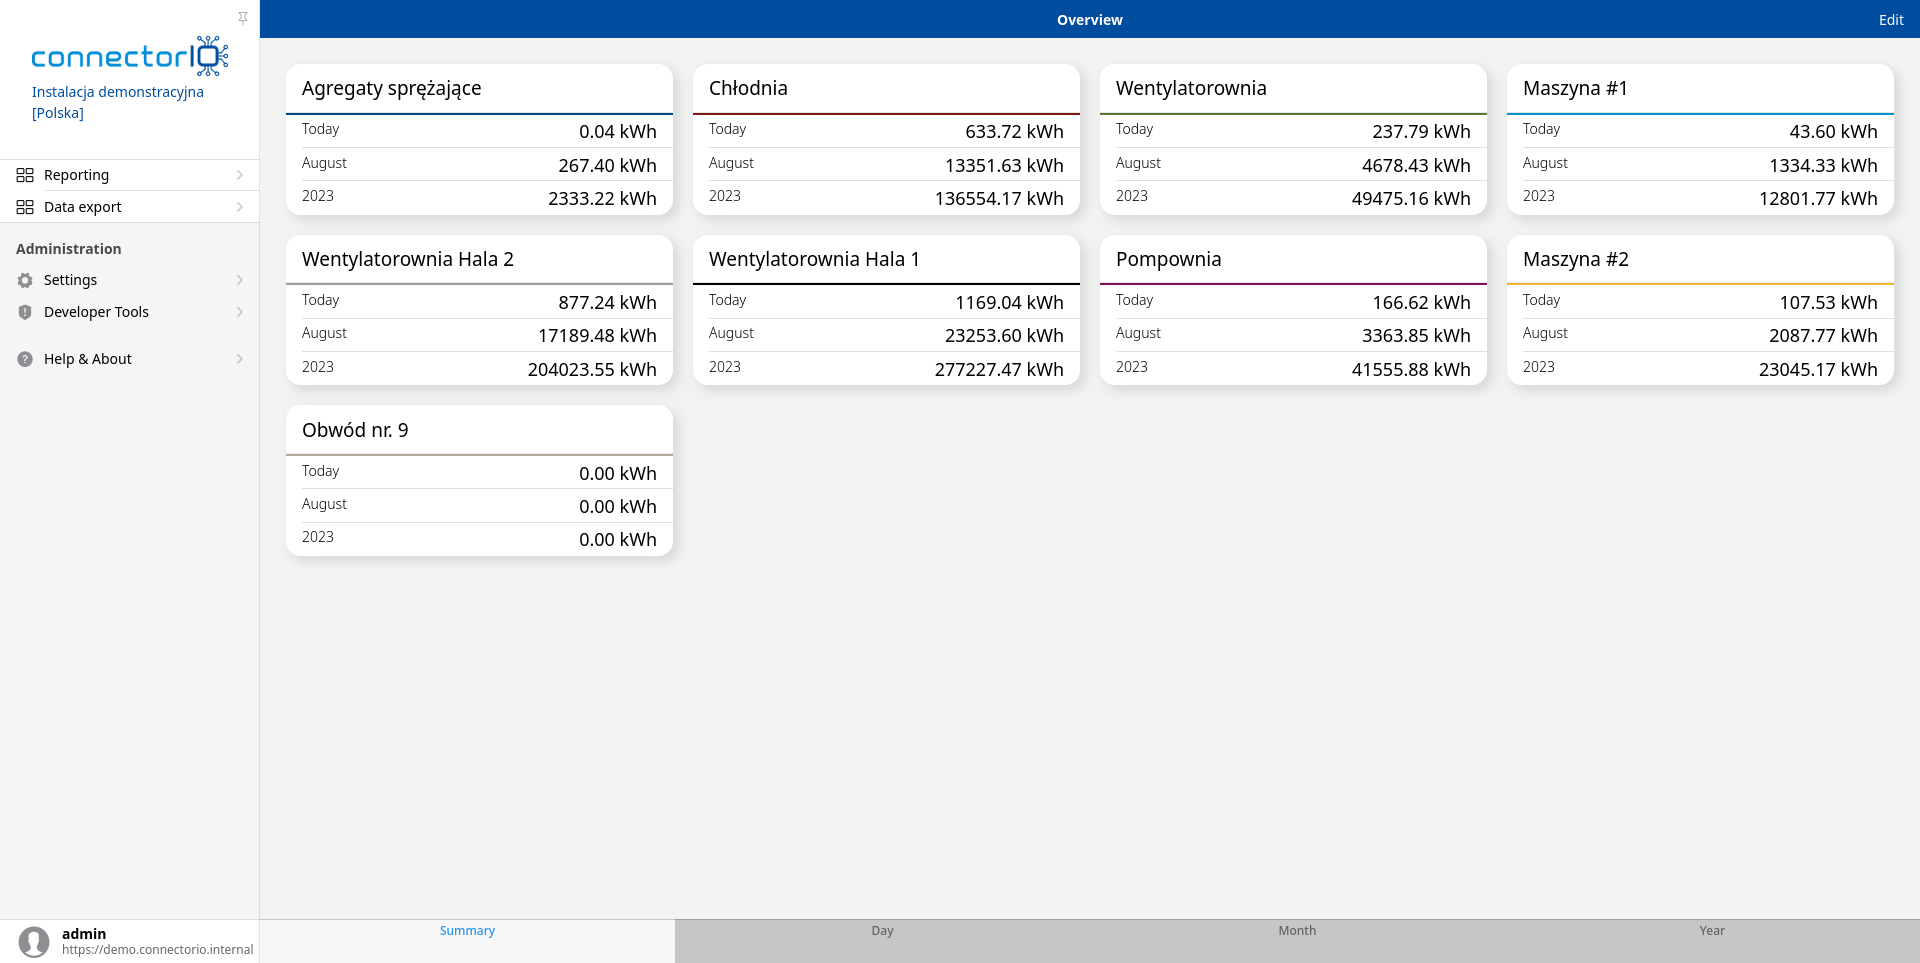
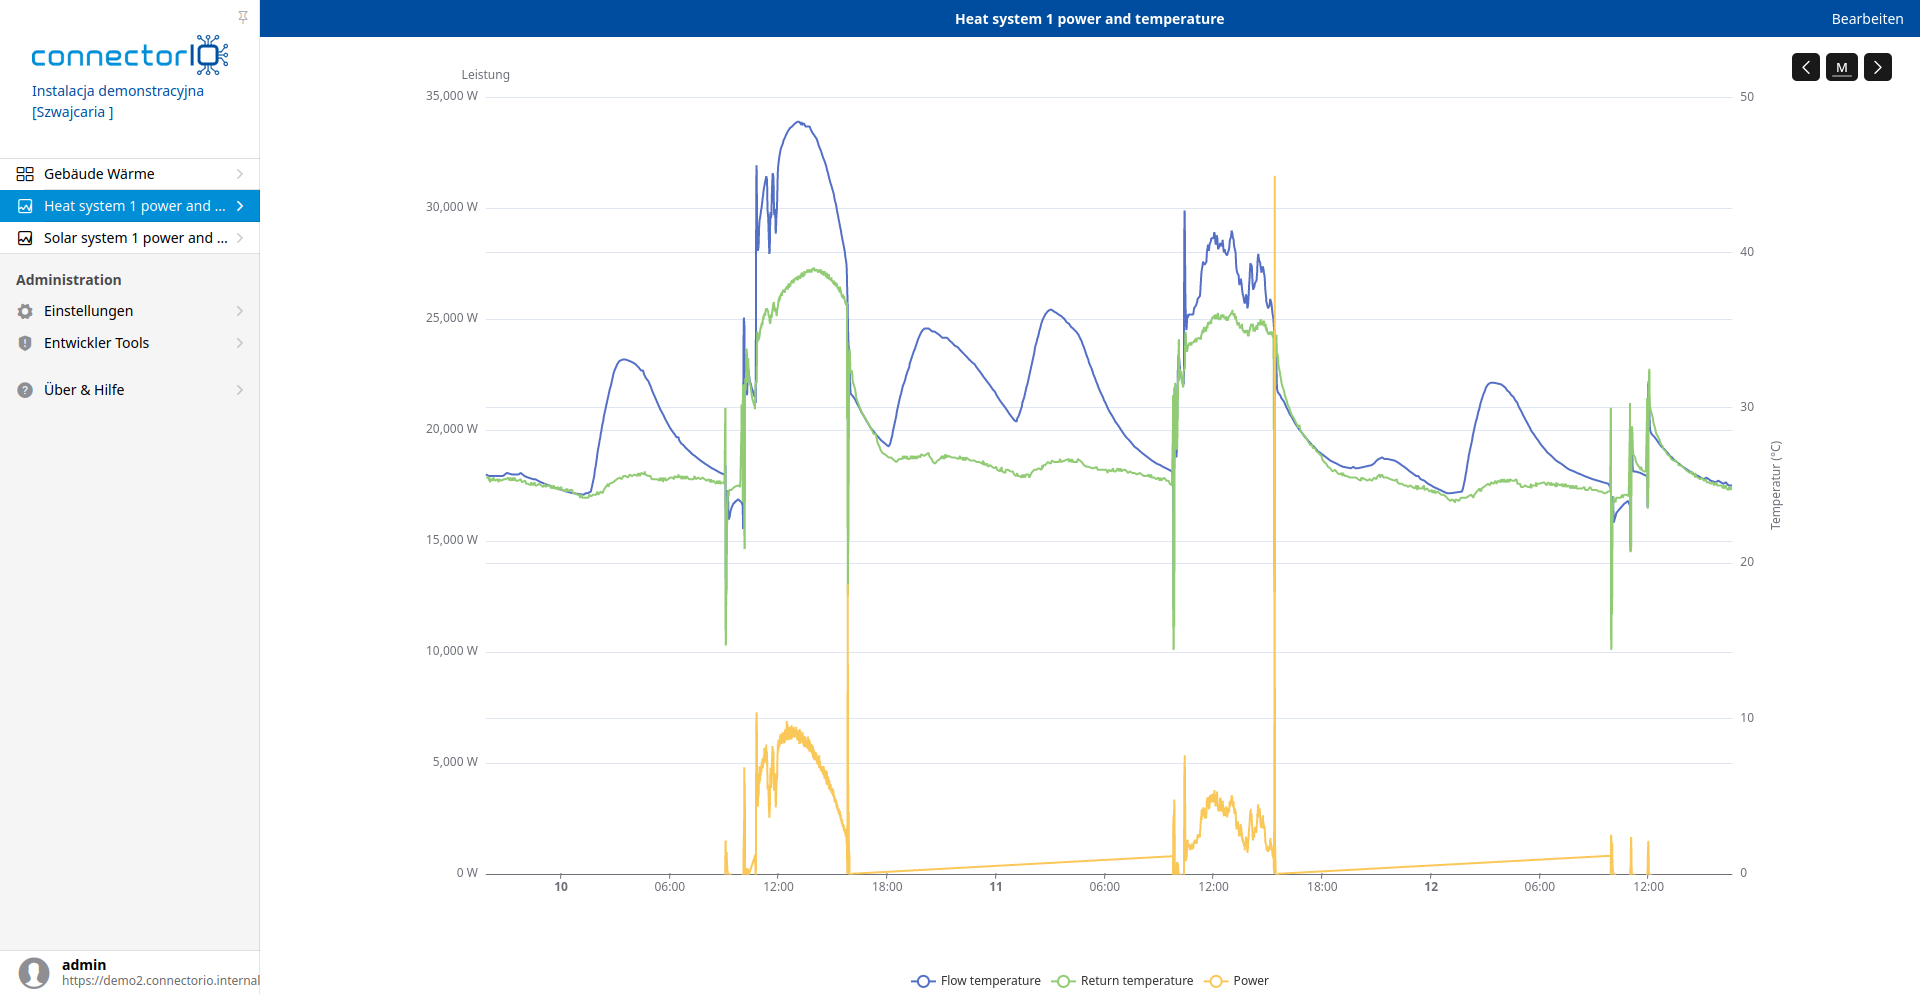
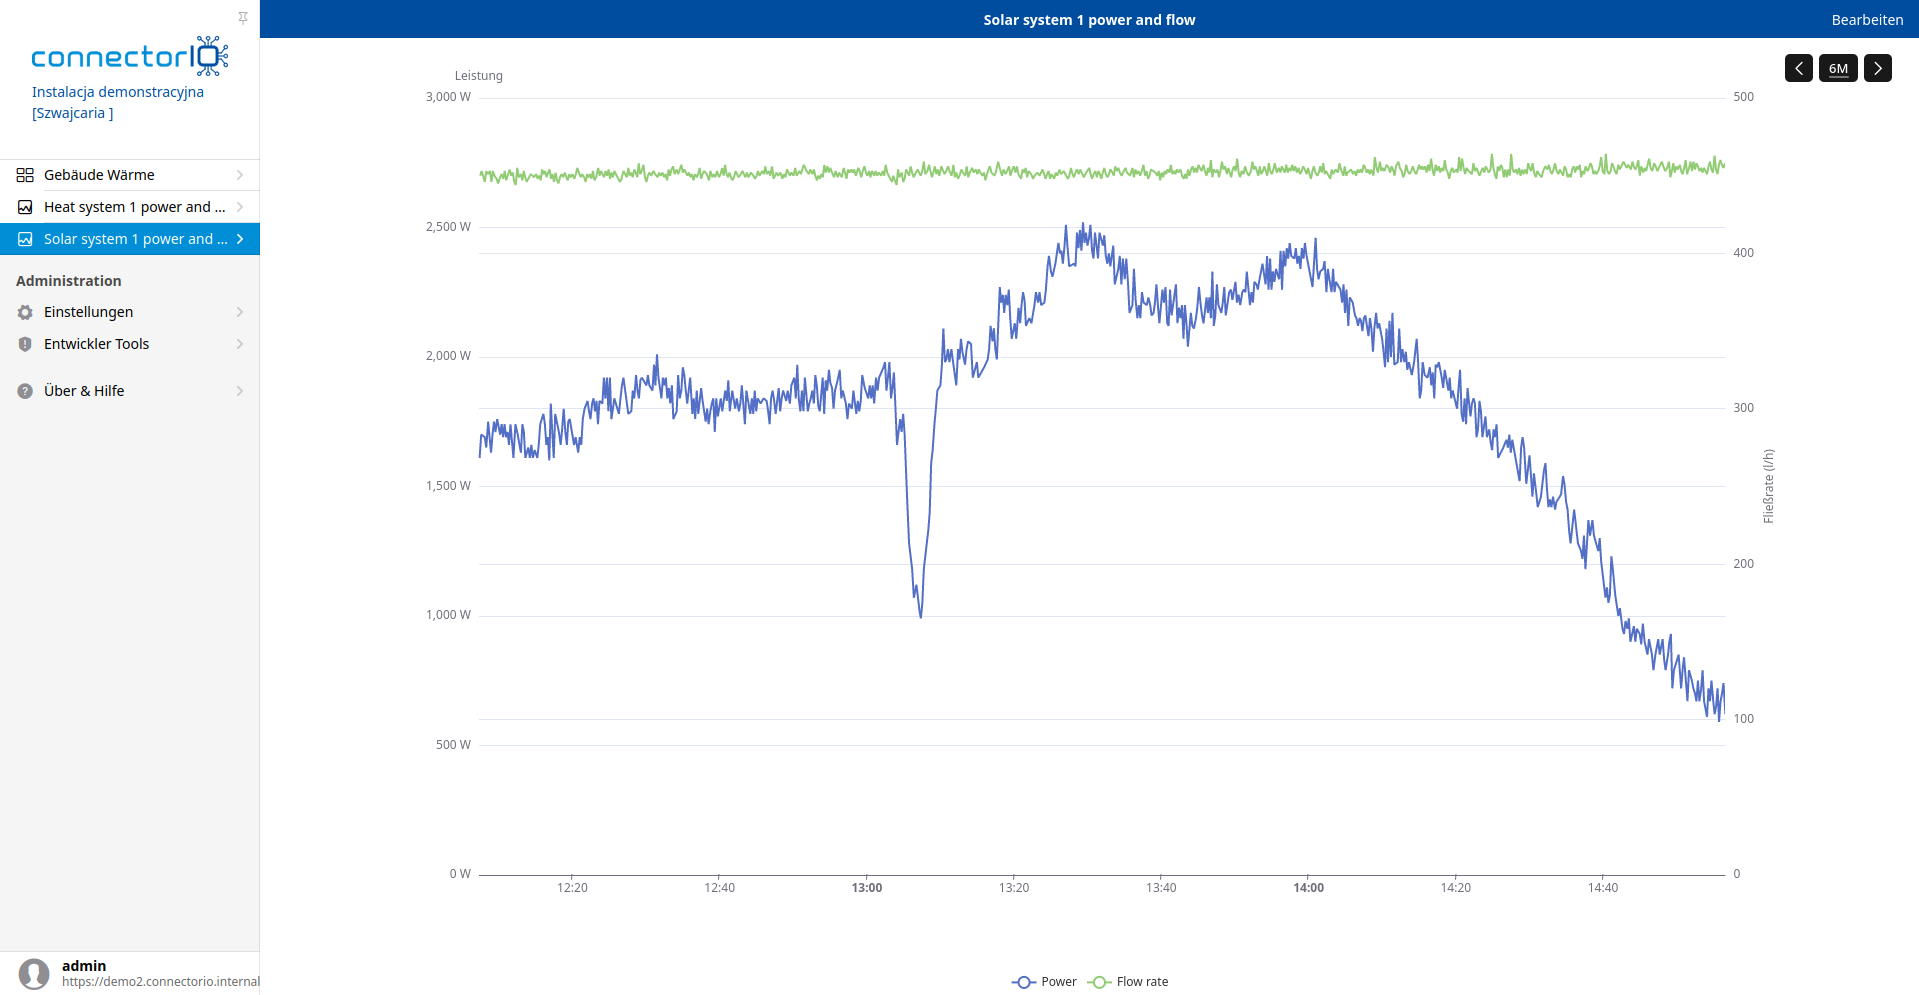
Most utility monitoring cases focus on power demand and energy consumption. We deal with these sites, but also with generation from renewable sources. With our software it is possible to gather multiple data profiles and deliver valuable insights on load, production as well as consumption. Through separation of physical layer (data acquisition) from storage model it is possible to make follow up analysis in further dimensions.
While demand and consumption sides can be seen as specific to heat and electricity we deliver valuable information for other utilities. Whether you are interested in liquids its volume or its flow, or monitoring of cold, we know how to handle them and integrate necessary meetering equipment. Maybe your manufacturing processes rely extensively on use of pressured air or other media? We can help you find effectiveness of these processes through combination of data brought by various meters.
Cost management
Energy and utilities play significant role in multiple businesses. Whether you manage a production facility or multifamily building, these costs are integral to your daily operations. Knowing how much energy is needed for specific services in shared spaces can point you which areas lack of supervision.
Traditionally, production, thanks to the excellent knowledge of statistical methods, is able to ensure margins in large-scale manufacturing. However, only verification of production cycle costs can allow to determine exactly which products actually contribute to profits and which to losses. Knowing the real values of consumed electricity, gas and other utilities will answer the basic question - how much does it cost to produce them.